Migrating agents from Elastic
Migrating Agents from Elastic
The Elastic Stack provides a number of Observability data collection agents. Specifically:
- The Beats family - such as Filebeat, Metricbeat, and Packetbeat - all based on the
libbeatlibrary. These Beats support sending data to Elasticsearch, Kafka, Redis, or Logstash over the Lumberjack protocol. - The
Elastic Agentprovides a unified agent capable of collecting logs, metrics, and traces. This agent can be centrally managed via the Elastic Fleet Server and supports output to Elasticsearch, Logstash, Kafka, or Redis. - Elastic also provides a distribution of the OpenTelemetry Collector - EDOT. While it currently cannot be orchestrated by the Fleet Server, it offers a more flexible and open path for users migrating to ClickStack.
The best migration path depends on the agent(s) currently in use. In the sections that follow, we document migration options for each major agent type. Our goal is to minimize friction and, where possible, allow users to continue using their existing agents during the transition.
Preferred migration path
Where possible we recommend migrating to the OpenTelemetry (OTel) Collector for all log, metric, and trace collection, deploying the collector at the edge in an agent role. This represents the most efficient means of sending data and avoids architectural complexity and data transformation.
The OpenTelemetry Collector provides a sustainable and vendor-neutral solution for observability data ingestion. We recognize that some organizations operate fleets of thousands—or even tens of thousands—of Elastic agents. For these users, maintaining compatibility with existing agent infrastructure may be critical. This documentation is designed to support this, while also helping teams gradually transition to OpenTelemetry-based collection.
ClickHouse OpenTelemetry endpoint
All data is ingested into ClickStack via an OpenTelemetry (OTel) collector instance, which acts as the primary entry point for logs, metrics, traces, and session data. We recommend using the official ClickStack distribution of the collector for this instance, if not already bundled in your ClickStack deployment model.
Users send data to this collector from language SDKs or through data collection agents collecting infrastructure metrics and logs (such OTel collectors in an agent role or other technologies e.g. Fluentd or Vector).
We assume this collector is available for all agent migration steps.
Migrating from Beats
Users with extensive Beat deployments may wish to retain these when migrating to ClickStack.
Currently this option has only been tested with Filebeat, and is therefore appropriate for Logs only
Beats agents use the Elastic Common Schema (ECS), which is currently in the process of being merged into the OpenTelemetry specification used by ClickStack. However, these schemas still differ significantly, and users are currently responsible for transforming ECS-formatted events into OpenTelemetry format before ingestion into ClickStack.
We recommend performing this transformation using Vector, a lightweight and high-performance observability data pipeline that supports a powerful transformation language called Vector Remap Language (VRL).
If your Filebeat agents are configured to send data to Kafka - a supported output by Beats - Vector can consume those events from Kafka, apply schema transformations using VRL, and then forward them via OTLP to the OpenTelemetry Collector distributed with ClickStack.
Alternatively, Vector also supports receiving events over the Lumberjack protocol used by Logstash. This enables Beats agents to send data directly to Vector, where the same transformation process can be applied before forwarding to the ClickStack OpenTelemetry Collector via OTLP.
We illustrate both of these architectures below.
```DIAGRAMS``
In the following example, we provide the initial steps to configure Vector to receive log events from Filebeat via the Lumberjack protocol. We provide VRL for mapping the inbound ECS events to Otel specification, before sending these to the ClickStack OpenTelemetry collector via OTLP. Users consuming events from Kafka can replace the Vector Logstash source with the Kafka source - all other steps remain the same.
Install vector
Install Vector using the official installation guide.
This can be installed on the same instance as your ElasticStack OTel collector.
Users can follow best practices with regards to architecture and security when moving Vector to production.
Configure vector
Vector should be configured to receive events over the Lumberjack protocol, imitating a Logstash instance. This can be achieved by configuring a logstash source for Vector:
If Mutual TLS is required, generate certificates and keys using the Elastic guide "Configure SSL/TLS for the Logstash output". These can then be specified in the configuration as shown above.
Events will be received in ECS format. These can be converted to the OpenTelemetry schema using a Vector Remap Language (VRL) transformer. Configuration of this transformer is simple - with the script file held in a separate file:
Note it receives events from the above beats source. Our remap script is shown below. This script has been tested with log events only but can form the basis for other formats.VRL - ECS to OTel
Finally, transformed events can be sent to ClickStack via OpenTelemetry collector over OTLP. This requires the configuration of a OTLP sink in Vector, which takes events from the remap_filebeat transform as input:
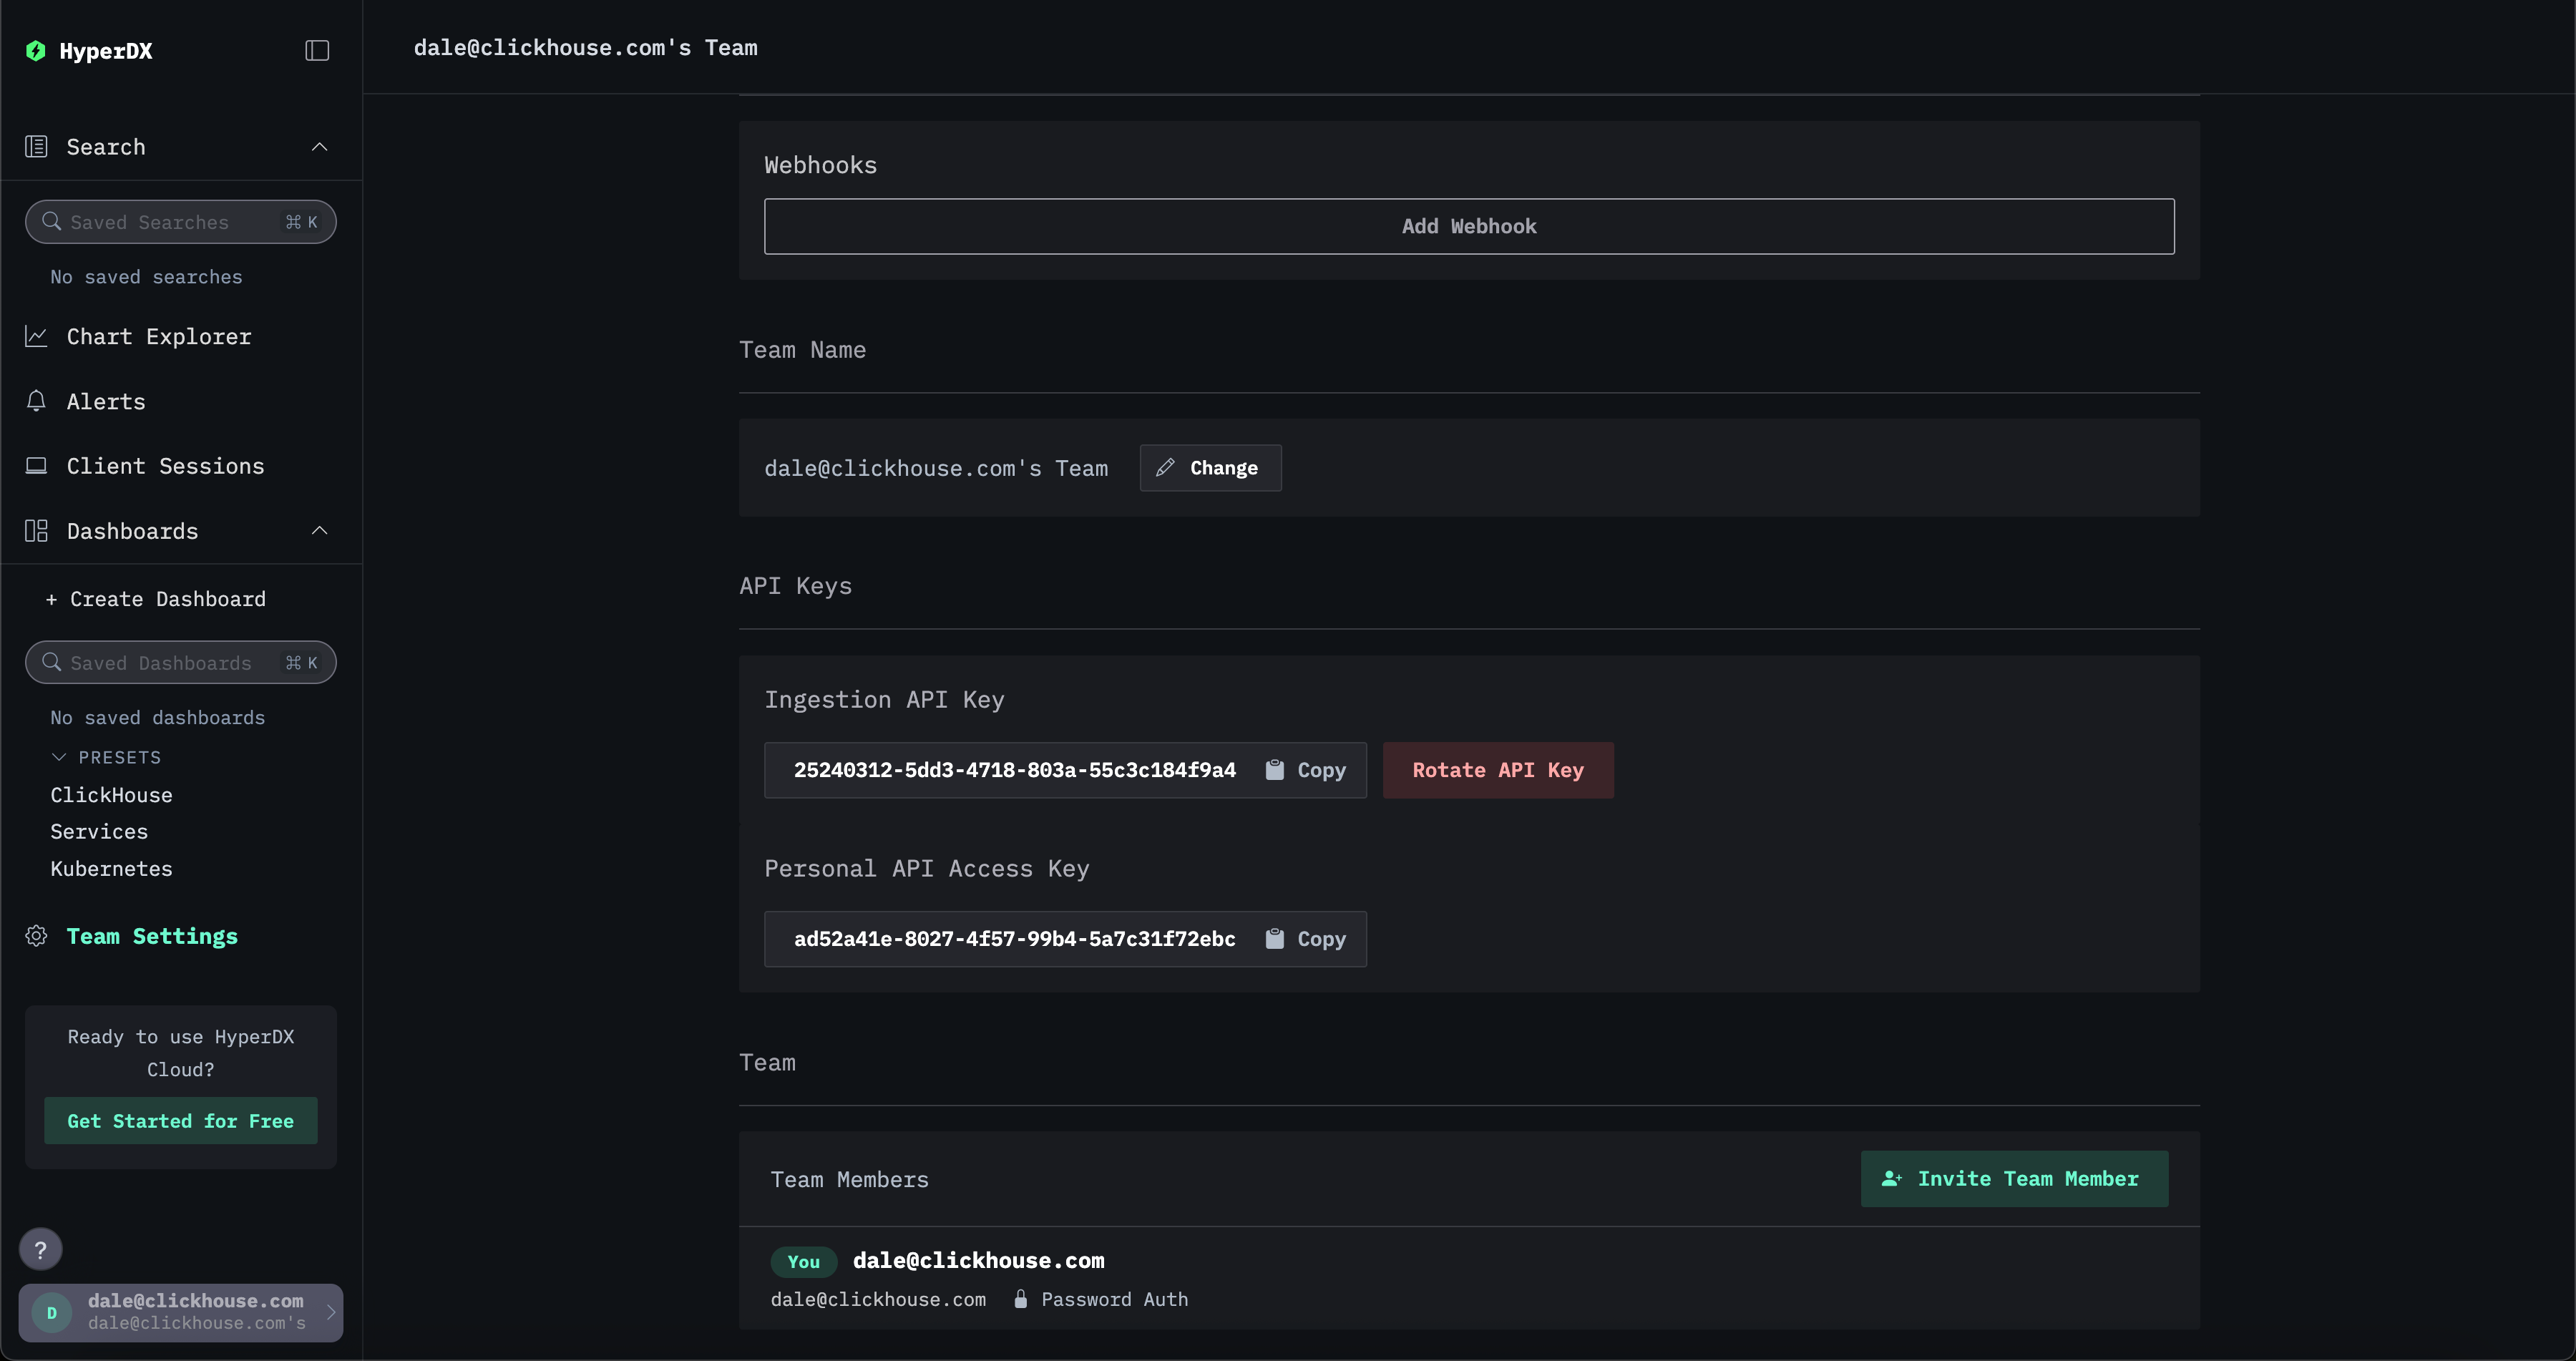
The YOUR_INGESTION_API_KEY here is produced by ClickStack. You can find the key in the HyperDX app under Team Settings → API Keys.
Our final complete configuration is shown below:
Configure Filebeat
Existing Filebeat installations simply need to be modified to send their events to Vector. This requires the configuration of a Logstash output - again, TLS can be optionally configured:
Migrating from Elastic Agent
The Elastic Agent consolidates the different Elastic Beats into a single package. This agent integrates with Elastic Fleet, allowing it to be centrally orchestrated and configured.
Users with Elastic Agents deployed have several migration paths:
- Configure the agent to send to a Vector endpoint over the Lumberjack protocol. This has currently been tested for users collecting log data with the Elastic Agent only. This can be centrally configured via the Fleet UI in Kibana.
- Run the agent as Elastic OpenTelemetry Collector (EDOT). The Elastic Agent includes an embedded EDOT Collector that allows you to instrument your applications and infrastructure once and send data to multiple vendors and backends. In this configuration, users can simply configure the EDOT collector to forward events to the ClickStack OTel collector over OTLP. This approach supports all event types.
We demonstrate both of these options below.
Sending data via Vector
Install and configure Vector
Install and configure Vector using the same steps as those documented for migrating from Filebeat.
Configure Elastic Agent
Elastic Agent needs to be configured to send data via the Logstash protocol Lumberjack. This is a supported deployment pattern and can either be configured centrally or via the agent configuration file elastic-agent.yaml if deploying without Fleet.
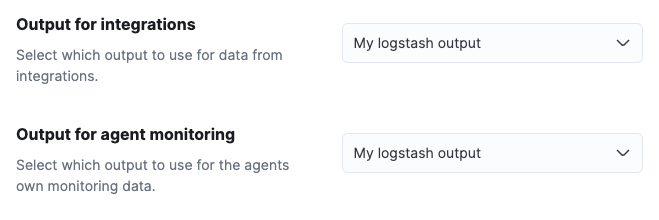
Central configuration through Kibana can be achieved by adding an Output to Fleet.
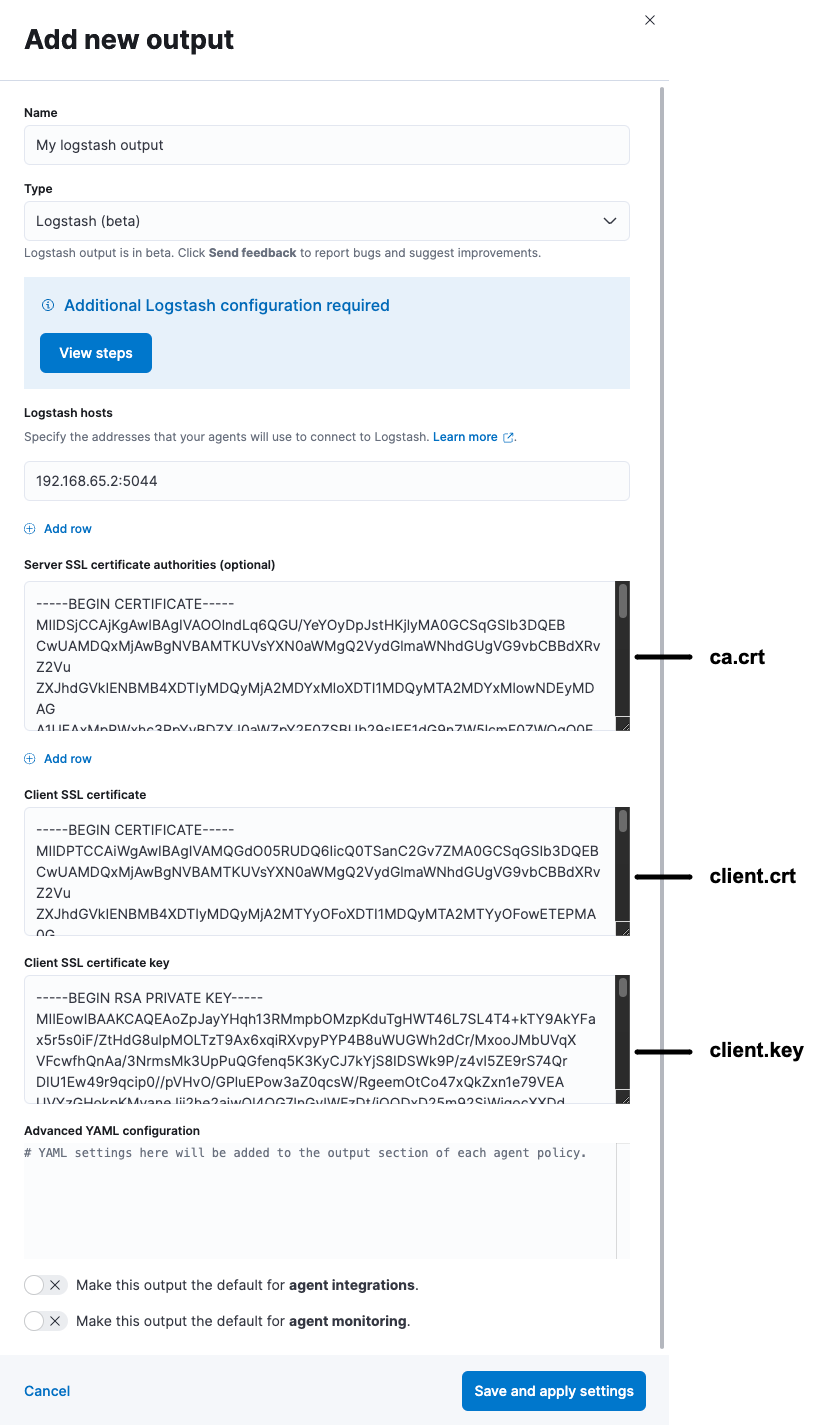
This output can then be used in an agent policy. This will automatically mean any agents using the policy will send their data to Vector.
Since this requires secure communication over TLS to be configured, we recommend the guide "Configure SSL/TLS for the Logstash output", which can be followed with the user assuming their Vector instance assumes the role of Logstash.
Note that this requires users to configure the Logstash source in Vector to also mutual TLS. Use the keys and certificates generated in the guide to configure the input appropriately.
Run Elastic Agent as OpenTelemetry collector
The Elastic Agent includes an embedded EDOT Collector that allows you to instrument your applications and infrastructure once and send data to multiple vendors and backends.
Users running the EDOT collector distributed with Elastic Agent will not be able to exploit the existing integrations offered by the agent. Additionally, the collector cannot be centrally managed by Fleet - forcing the user to run the agent in standalone mode, managing configuration themselves.
To run the Elastic Agent with the EDOT collector, see the official Elastic guide. Rather than configuring the Elastic endpoint, as indicated in the guide, remove existing exporters and configure the OTLP output - sending data to the ClickStack OpenTelemetry collector. For example, the configuration for the exporters becomes:
The YOUR_INGESTION_API_KEY here is produced by ClickStack. You can find the key in the HyperDX app under Team Settings → API Keys.
If Vector has been configured to use mutual TLS, with the certificate and keys generated using the steps from the guide "Configure SSL/TLS for the Logstash output", the otlp exporter will need to be configured accordingly e.g.
Migrating from the Elastic OpenTelemetry Collector
Users already running the Elastic OpenTelemetry Collector (EDOT) can simply reconfigure their agents to send to ClickStack OpenTelemetry collector via OTLP. The steps involved are identical to those outlined above for running the Elastic Agent as an OpenTelemetry collector. This approach can be used for all data types.
